Searching for trading opportunities can be very time-consuming, but the Thinkorswim scanner can make it much easier for you!
The ThinkorSwim (ToS) platform by Charles Schwab can save you a ton of time searching for trades. That is, once you understand how to set it up. It’s isn’t difficult, and once you get the hang of it, you’ll be tweaking scan parameters to narrow down your search results. In this article, we’ll take a quick tour of how to scan for trades using ToS.
To download ToS, head over to Charles Schwab and click Tools and Platforms. Then look for ToS desktop and the download link. You’ll need a Schwab login/account to use ToS but it’s free. Now that you have the software open, here's how to scan for trades using ThinkorSwim.
Where To Find The Thinkorswim Scanner
Once you log into ToS, you’ll find the scanner under the Scan tab, as shown in the image below.

Under the scan tab are different types of scans that can be run. They include:
The Stock Hacker is displayed in the above image. There are four parameters listed (net change, volume, % change, impl vol). Each parameter lets you set a minimum and maximum value. Stocks that fall within those criteria will be displayed once you run the scan.
Let’s see what the scanner’s search results look like. We’ll keep the four parameters above, but instead of using the default values, we will add our own. You can change values by typing them into the min/max boxes or by adjusting the sliders. After some adjustments, click the Scan button to see the results.

You can add more columns to the results by clicking the (very) small gear icon to the right of the Vol Index column. Then click customize in the popup menu. Add and change columns as you like.
Now let’s look at how to scan for trades using ThinkorSwim using different parameters to get specific results.
Adding Parameters
Let’s say you’re looking for stocks that have large price moves. Rather than using the "Net Change" parameter, we’ll use percentage. Using percentage allows us to scan for price moves independent of the stock price.
Change "Net Change" to "% Change." We’ll look for moves of at least 15% up or down. How exactly do we set up a scan that looks for prices greater than 15% or less than 15%? We’ll need two parameters.
Instead of adding them to the top section, we need to add them to the “Any of the following” section. That section creates an OR between parameters rather than an AND, like the top section. Click the “+ Add filter” button on the far right to add two new parameters in this blank section.
For the top section, we’ll use stock volume and add "Stock last (price)." We’ll scan for stocks with a price of at least $100. Your new scan should look like the following:

Once you click scan, results (depending on the current market) should show up. UPST (Upstart) seems to be the only stock that meets our criteria. By loosening up our stock price criteria, we can expand the search results and see what else is out there. Let’s start with something low. We can always tighten it up later.
Change the value of "Last" to 25. In my case, I received four results for this criteria. We can see that restricting to a price of 100 is too high for volatile stocks.
You can save this scan, so it doesn’t have to be created every time you want to use it. In the top right next to “Add condition group,” click the icon with three horizontal lines. From there, you can save the query.
Next, we’ll see how to add technical analysis, such as looking for stocks that are above their 50-Day Moving Average.
Related: 5 Tools Every Investor Should Use
Adding Technical Studies
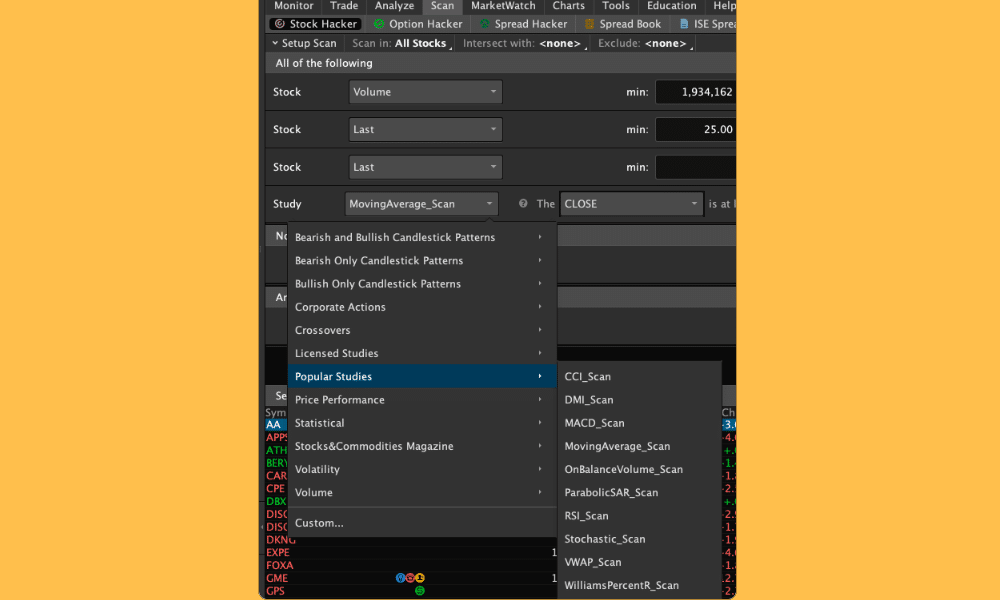
In this scan, you can remove the two lower parameters in the “Any of the following” section. Add a new "Study" parameter to the top section. Set this parameter to Popular Studies > MovingAverage_Scan, as shown in the image below.

In the moving average scan parameter, we’ll look for a price that is 10% above the 50-Day Moving Average.

When we ran this scan, 44 results displayed, including AA and CAR. If we check the charts for AA and CAR, we can see that their prices are, in fact, above their 50-Day Moving Averages (red lines).


You can also scan by fundamental analysis such as cash flow per share, earnings per share net income, price/earnings (P/E) ratio, and a whole lot more.
Final Thoughts
The best way to learn to scan for trades using ThinkorSwim is to keep adjusting parameter values and trying out new ones. As you add more parameters to a scan, don’t forget to save your work. You’ll soon find that the scanner is your best friend and a huge time-saver.
Remember, while ThinkorSwim is free (including its trade scanner), you'll need to be a Charles Schwab client to use it. Get started now with Charles Schwab >>>

Robert Farrington is America’s Millennial Money Expert® and America’s Student Loan Debt Expert™, and the founder of The College Investor, a personal finance site dedicated to helping millennials escape student loan debt to start investing and building wealth for the future. You can learn more about him on the About Page or on his personal site RobertFarrington.com.
He regularly writes about investing, student loan debt, and general personal finance topics geared toward anyone wanting to earn more, get out of debt, and start building wealth for the future.
He has been quoted in major publications, including the New York Times, Wall Street Journal, Washington Post, ABC, NBC, Today, and more. He is also a regular contributor to Forbes.
